Is Glasshouse production-ready at 1.0.0?
Yes. 115 tests pass across 22 suites under Vitest 4 with coverage about 88.48% of statements; TypeScript
maximum strict mode is clean; Biome lint is clean; publint and
@arethetypeswrong/cli are clean across every subpath. The suite and the distribution smoke test
are run on the Node 20, 22, and 24 matrix. Every published release carries SLSA provenance produced by
GitHub Actions.
Why not just read the raw spans yourself?
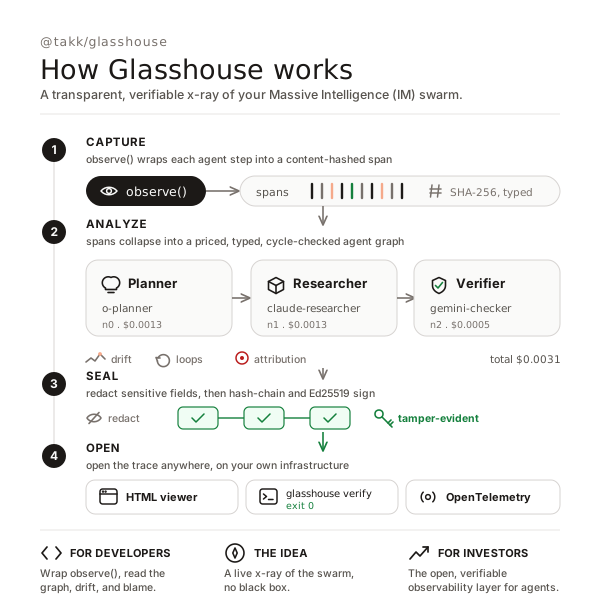
You can, and a raw OpenTelemetry SDK gives you spans. But a swarm is a graph, not a flat list: you want to
see which agent handed off to which, where a run looped, and which agent to blame when it failed.
Glasshouse turns the spans into a renderable agent graph, runs drift and loop detection over the stream, and
attributes failures, so you read behavior instead of scrolling a span dump.
Why not use a closed observability box?
You can, and many do. The cost is a black box that hides which model answered and the path it took, on
infrastructure you do not own and that may block the EU. Glasshouse is the glass house: it exposes the agent
graph, the per-step decisions, and the cost, it is OpenTelemetry-native, and it runs in your process on your
own infrastructure, so the trace is yours to inspect.
Does Glasshouse call any model itself?
No. Glasshouse is observability over your own swarm. You wrap each agent step in observe() and
it records the span, builds the graph, watches for drift, and seals the audit chain. It makes no model calls
of its own, which keeps it dependency-free and testable with no network, and it means your provider keys
live in your client, never in Glasshouse.
Does this work in Cloudflare Workers, Vercel Edge, Bun, or Deno?
Yes. The core is node-free; it uses the Web Crypto API for SHA-256 and Ed25519, not node:crypto.
Import @takk/glasshouse or @takk/glasshouse/edge on any runtime with Web Crypto, and
ship spans with the OTLP or fetch exporter. Only @takk/glasshouse/node, the file exporter and
JSON loaders, requires the Node standard library.
How does Glasshouse handle my data?
Glasshouse holds the spans you record, the graph it builds, and the audit chain it seals, nothing else. It
makes no outbound network calls of its own beyond the exporter you configure, and redaction runs before any
span leaves the process. With the file loaders, only the trace or run files you point it at are read from
disk, and no provider credentials are ever held by Glasshouse.
What does a span kind actually mean?
A span kind labels what a step did, so the graph is typed and the detectors know what to read. The nine
kinds are agent, reasoning, llm, tool, memory, state, decision, verification, and handoff. You pass the kind
to observe(), and Glasshouse uses it to render the node, attribute a failure, and tally cost on
the llm spans. Read the kinds off the graph to see exactly how the swarm behaved.
Is the audit trail a digital signature?
The chain itself is an integrity seal: each entry is chained to the previous one through a SHA-256 hash of
its canonical form, so any later edit breaks the chain. On top of that, a snapshot can be signed with
Ed25519 over the Web Crypto API, which does prove who produced it. Use the hash chain for tamper-evidence
and the signature when you need third-party attribution.
Which providers and frameworks does it support?
Any of them. Because you call observe() around your own steps, Glasshouse traces a swarm built
on OpenAI, Anthropic, Google, a local model, or any framework, treated uniformly as agents in the graph.
Spans are OpenTelemetry-compatible, so they export to any OTLP backend you already run.
Where does the state live?
In-process memory by default, with portable JSON snapshots via snapshot() and
fromSnapshot(), the spans and the scalar configuration. For disk-backed output, write spans or
load a saved trace from JSON with @takk/glasshouse/node. For an edge runtime, snapshot to your
own KV store between invocations, or stream out through the OTLP exporter.
How does it keep cost visible?
Every llm span carries the token counts your client reports, so the per-step dollar cost is on the node and
the run-level tally sums it. A runaway agent shows up at once as a costly node in the graph. Glasshouse does
not cap spend itself, it makes it visible, so your orchestrator can act on the signal, and trace sampling
keeps the telemetry volume affordable.
How do I verify a published version's provenance?
Every release is published with npm publish --provenance. Check the attestations with
npm view @takk/glasshouse@<version> --json | jq .dist.attestations. The attestation
links the tarball you installed to the GitHub Actions workflow that built it from a specific source commit.
What is the policy on breaking changes?
Strict SemVer 2.0.0, starting from 1.0.0. The binding stability surface is documented in SPEC.md section
5. Major bumps require a deprecation cycle; security fixes follow the disclosure flow in SECURITY.md.